Information is the most important base for
environment protection, environment planning and environment policies.
Measurement data and station information:
recording
administrating
analysing
|
|
HIS'3D®
|
- the environmental data management system
- the Hydrographical Information System
- the database system for administrating and evaluating environmental data
|
|
Please click the pictures to enlarge them.
Data Sources
- from highly frequent data series of one parameter (quantity) up to singular environment reports of some
hundred parameters (quality)
- online measurement, data collectors, digitised data values, files in different formats
- e.g. water stage and flow, chemical, biological values, meteorology, profiles (geodesy), etc.
Measurement Station Information
- stored in the database with timing information
- e.g. station name, coordinates, contact person, as well as public orders, maps, plans
User Access Rights
- in several privilege steps
- saves data before unwanted access
- protects from unintentional data changes
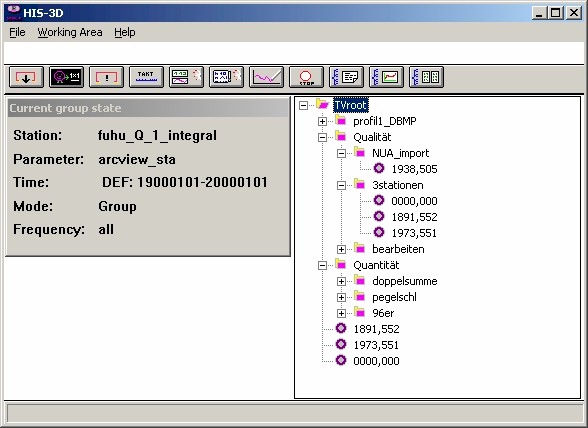
Data Access
- using the group system SPT: station, parameter, time
- cycle time: presentation and evaluation
- are independent from the data sampling interval
- easy access to data values
- presentation in dialogue boxes
- exportable to formatted lists
-
Editing
- numerical and graphical
- data series: move, turning around a point, copying, adding of values by interpolation and regression
with stations in the neighbourhood
- protocol of changes (who/when/why)
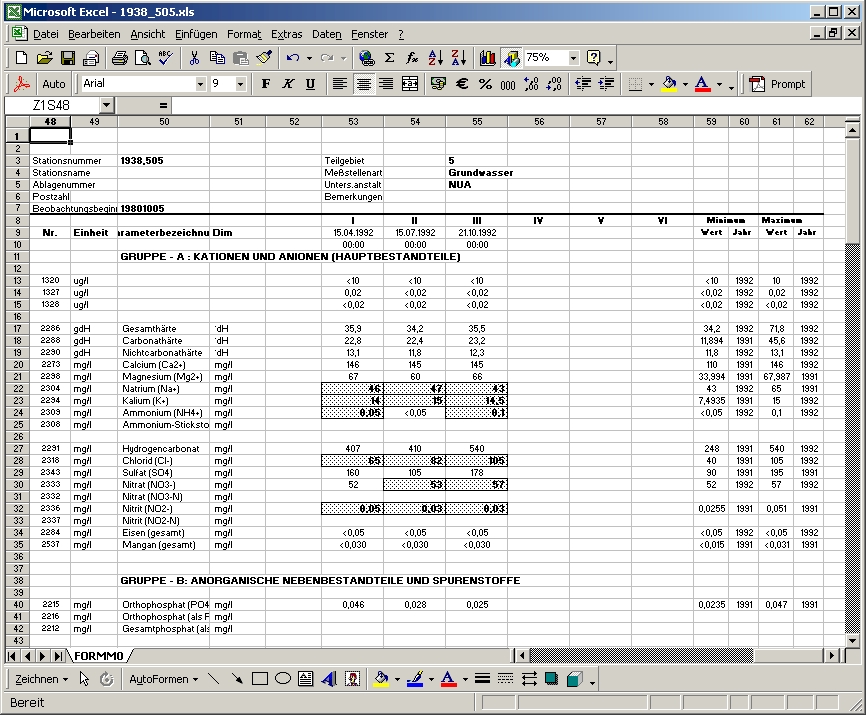
Import/Export Of Data Values
- freely formatable; manual and automatic import
- is fault tolerant and learnable against wrong spelled words
- MS-Excel and ASCII tables with data values are simply dragged into the application
- automatic testing during import (e.g. plausibility) and export (e.g. cell formatting at values with
boundary value violations, drinking water codex)
- XML for logically formatted exports
Graphics
- widely formatable, storable layout
- 2D-pictures (curve), 3D-surface
- colour intensity plots, isolines
Analysing Methods
- independent from samping interval (e.g. only 700 values)
- all results are output to a file, a graphic, or the database
- Script language (C) for criteria and analysis
- statistics (mean, sliding mean, minimum/maximum, variance, median)
- regression (over time and data series), trend, histogram
- arbitrary algebraic combining of data series (movable over time)
- double sum, flow-duration curve
- polygonalisation (data reduction)
- method and plausibility check
The System Environement
- User Desktop
- The client is available for different operating systems, like MS-Windows (drag-and-drop, clipboard, DDE, OLE, context help).
- adaptable to the user's needs
- Database
- runs on a server or on the same single workstation
- e.g. OracleTM or MS-AccessTM
HIS'3D® is an open system
- expandable by new methods
- extendable by new data sources and parameters
- open to other packages, e.g.: MS-ExcelTM, MS-WordTM, ArcInfoTM, ArcViewTM
- operating system (MS-WindowsTM NT/2000, Linux, Unix) and database independent
Expansionsmodules:
Use the info-form to request further information.